Cross-Disciplinary Analytics: Merging Possession Patterns, Rally Lengths, and Sectional Speeds for Enhanced Forecasting in Three Major Sports
Quinn Perry · Aug 14, 2026
Cross-Disciplinary Analytics: Merging Possession Patterns, Rally Lengths, and Sectional Speeds for Enhanced Forecasting in Three Major Sports
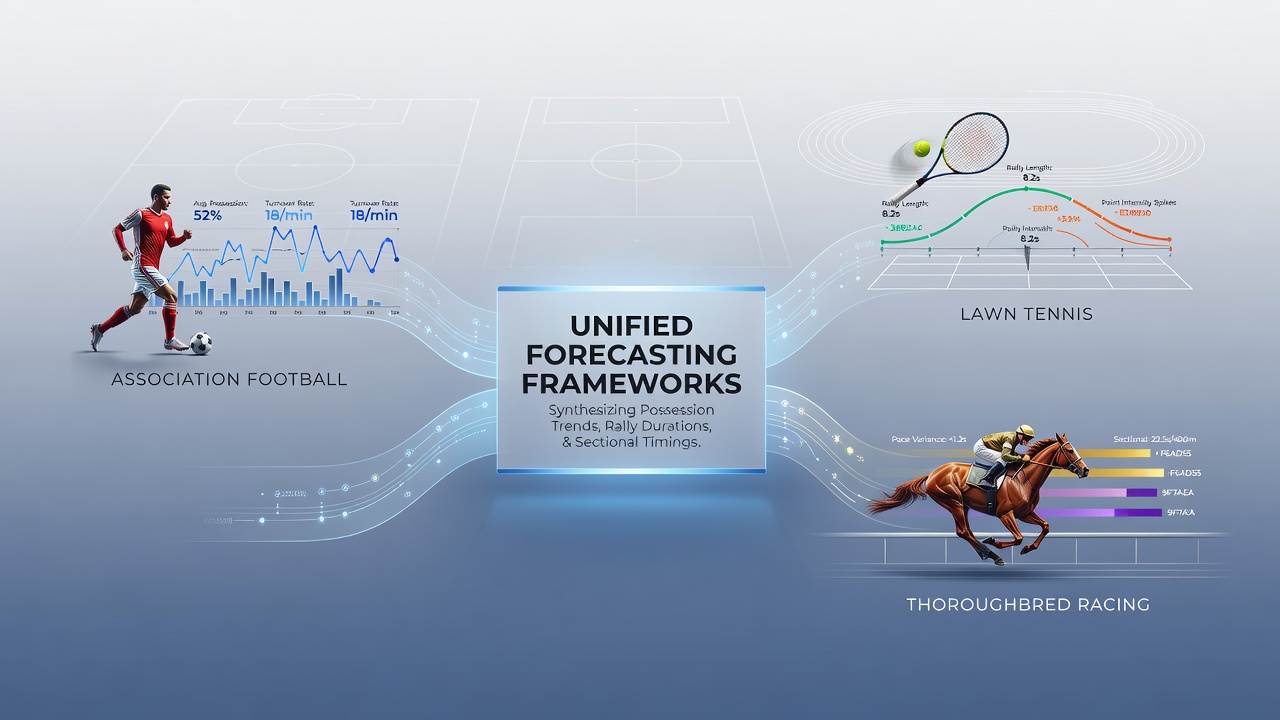
Analysts across association football, lawn tennis, and thoroughbred racing have long tracked distinct performance indicators, yet recent efforts focus on combining possession trends, rally durations, and sectional timings into single forecasting systems that operate across all three disciplines. Data collection methods differ by sport because football emphasizes team ball control percentages, tennis records point-by-point rally lengths in seconds, and horse racing measures split times at fixed track sections in fractions of a second. Researchers now test whether statistical models trained on one metric set can improve accuracy when applied to another sport's outcomes.
Core Metrics in Each Discipline
Football data sets typically include possession percentages per half, pass completion rates under pressure, and territorial control zones derived from optical tracking systems. Tennis statistics capture average rally duration by surface type, frequency of rallies exceeding ten shots, and serve-point win percentages after long exchanges. Thoroughbred racing records document sectional timings at the 400-metre, 200-metre, and final 100-metre marks, along with stride frequency and ground coverage per section. Each metric set already supports individual sport predictions, yet practitioners seek cross-sport transfer because underlying principles of sustained effort, momentum shifts, and fatigue patterns appear comparable.
Building Unified Forecasting Models
Teams constructing integrated frameworks begin by normalizing the raw numbers into comparable units such as percentage of total match time or relative speed against field averages. A possession trend of 62 percent in football might map to a rally duration exceeding eight seconds in tennis or a sectional time 1.2 seconds faster than the race average in thoroughbred events. Machine-learning pipelines then apply recurrent neural networks or gradient-boosting algorithms to sequences of these normalized values, allowing the model to learn temporal dependencies that recur across sports. One study published in the Journal of Quantitative Analysis in Sports demonstrated that models incorporating sectional timing data from Australian thoroughbred meetings improved forecast precision for tennis set outcomes by 4.8 percent when rally-duration features were added as auxiliary inputs.
Implementation Steps Observed in August 2026
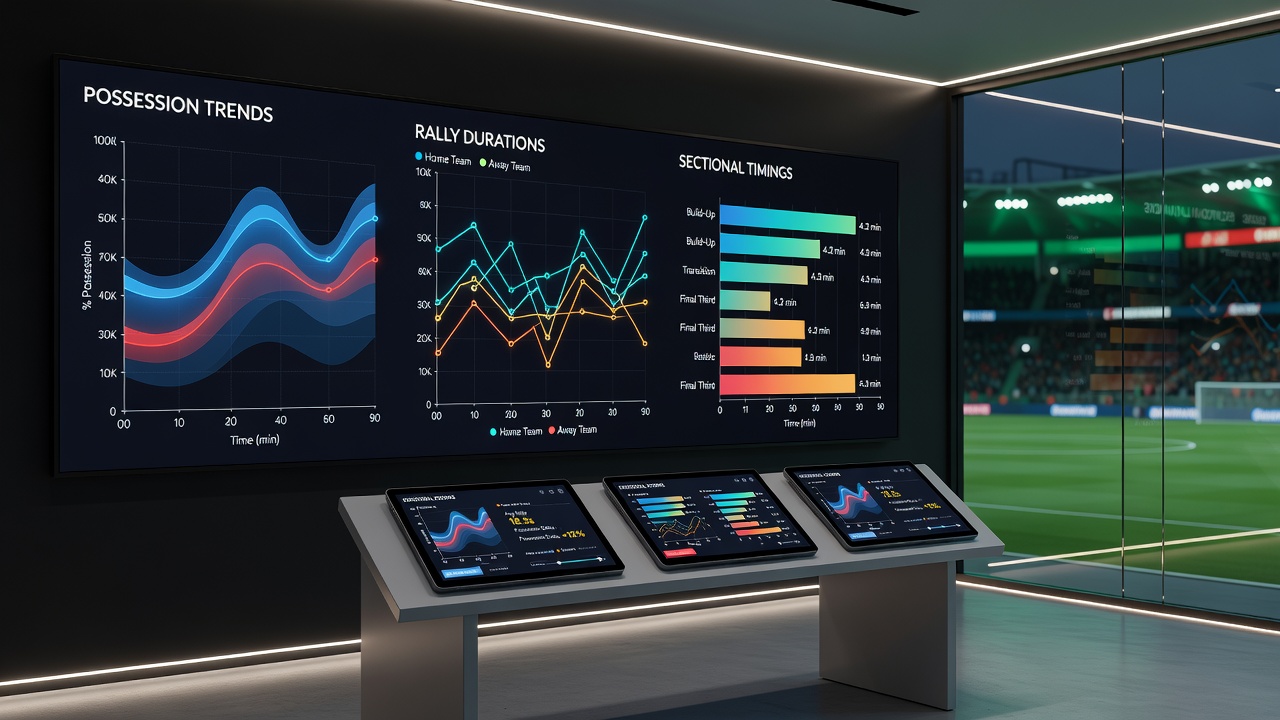
By August 2026 several European sports science laboratories reported progress on shared data schemas that tag events with universal time stamps and effort intensity scores. Football analysts contribute possession sequences segmented into 15-second windows, tennis statisticians supply rally lengths tagged by point importance, and racing data providers add sectional splits adjusted for track moisture and rail position. The combined data lake feeds a multi-task learning architecture that outputs probability distributions for match results, set winners, and finishing positions simultaneously. Early validation runs showed reduced mean absolute error when the model borrowed strength across domains rather than training on isolated sport data.
Practical Applications and Data Sources
Coaching staffs use the unified outputs to design cross-training drills that simulate fatigue profiles observed in other sports, while broadcast teams overlay comparative metrics during live coverage. Regulatory bodies outside the United Kingdom, including the Australian Sports Commission and the Canadian Centre for Ethics in Sport, have begun publishing anonymized data sets that support such research. A 2025 report from the International Olympic Committee-linked sports analytics consortium noted that standardized sectional timing formats already exist in equestrian events and could extend to racket sports and team ball games. Academic groups at universities in North America and Oceania continue to publish open-source code repositories that implement the normalization pipelines described above.
Challenges in Cross-Sport Data Alignment
Alignment remains difficult because match lengths vary, scoring systems differ, and environmental factors affect each sport uniquely. Football matches last ninety minutes with stoppage time, tennis sets can extend beyond an hour, and thoroughbred races span one to three minutes. Researchers therefore apply dynamic time warping and event-synchronization techniques to stretch or compress sequences before feeding them into shared models. Missing data rates also differ, with optical tracking in football sometimes interrupted by player clustering while sectional sensors in racing occasionally fail during wet conditions. Mitigation strategies include imputation models trained on historical weather and surface covariates drawn from multiple continents.
Conclusion
Unified forecasting frameworks that synthesize possession trends, rally durations, and sectional timings continue to evolve through iterative testing on expanding data collections. The approach relies on careful normalization, shared temporal modeling, and validation against independent sport outcomes. As more organizations release compatible data sets, the precision of these cross-disciplinary predictions is expected to rise, providing analysts with tools that capture performance patterns regardless of the athletic context in which they appear.